Timing Matters
People are more interested in umbrellas when it is raining, bathing suits when it is warm, and jackets when it is cold. The importance of timing and seasonality for these purchases is obvious. However, far more than just scarves and sunscreen are seasonal. Even interest in one of the biggest purchases people make, their house, appears to follow a repeating annual pattern.
The Data
We can estimate interest in a particular topic by analyzing search volume data from sites like Google. Because Google rescales the data before releasing it, the individual units of this data aren’t particularly informative. However, the relative changes tell an intriguing story.
We’ll limit the search data we consider to searches from the United States. This targets the northern hemisphere so that the data is effected by only one season at a time. We have many options for search terms: “House for Sale”, “Houses for Sale”, “Homes for Sale”; you get the picture. Happily, they all show pretty much the same seasonal pattern. We’ll use the term “Homes for Sale”, because it has a little larger overall search volume.
The seasonality of people’s interest in homes for sale should also be reflected in the prices they are willing to pay for a home. To investigate this connection, let’s also look at home price data collected by the US Federal Housing Finance Agency.
The Analysis
With the help of R and some time series analysis, we can decompose the observed search volume into three parts. A smoothed trend line showing long term change, a repetitive seasonality, and some leftover that we can call “random.”
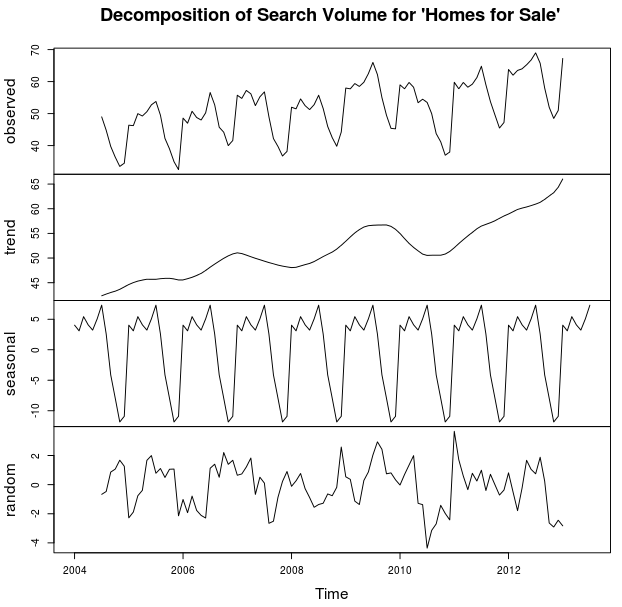
The Seasonality
There is a clear repeating seasonal pattern in the search volume of “homes for sale.” Here is an estimate of one cycle of this pattern.

This estimate shows a high plateau of interest in “homes for sale” in the spring and summer, low interest in November and December, and a rather steep decline in the fall. Let’s see if home prices show an analogous seasonality. Using a similar analysis, here is an estimate of one cycle of the seasonality for home prices.
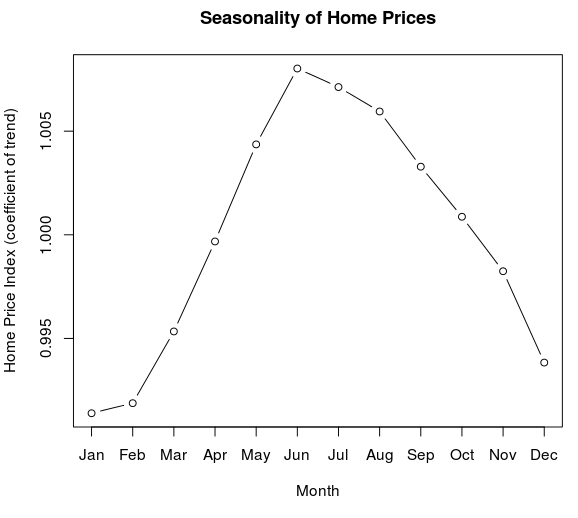
Purchase prices of homes seems to be higher in the summer and lower in the winter.* This corresponds pretty well to the seasonality of interest in homes for sale that we see in the search volume. As one would expect, larger amounts of interest seem to correspond to higher prices. However, the interest seems to come first. The lag in prices might be explained by the time it takes to actually go through the process of finding and buying a house.
As to why there is seasonality in interest and prices, I have no idea. It could have something to do with school schedules. However, my personal just-so-story involves trying to carry a desk across an icy parking lot. My personal desire to move is highly seasonal.
When to Sell
Houses and circumstances are often unique. This broad national data can’t tell us the best time to sell a given house. However, all things being equal, we can make a reasonable guess when the probability of fetching a high price will be greatest.
The seasonality we see in interest in homes for sale suggests that the spring is a good time to list a house for sale. The seasonality in home prices suggests that the summer is a good time to sell. Because of the decline of interest in homes for sale in the fall and the lower prices in the winter, one might want to reconsider listing in the fall and selling in the winter.
With these two housing data sets we can also estimate what time of year one has a higher probability of buying at a good price. As a buyer, one would want to go against the cycle; start looking in the fall, buy in the winter. If the prices work out, moving in the winter might even be worth the trouble.
* This pattern of highs in the summer and lows in the winter also seems to be reflected in the quarterly values of the Case-Schiller home price index.