Why Anomaly Detection is Super Useful
Imagine for a moment that you invented a time machine. It is a shiny device that allows you to travel to the future and see what is about to happen. The first time you use it, you arrive in the near future with all the whirring, clanking, and smoke you would expect from time travel. As you squint through the haze, you become convinced the machine didn’t actually work, because the near future looks the same as the time you left. You are shortly pulled back to your departure time and slowly realize that the future it showed you is exactly what is happening. Time travel wasn’t as exciting as you had hoped because your immediate future was pretty much the same as your present. Turns out you could have predicted the near future without all that space-time continuum stuff. You could simply assume it will be like the present.
As it turns out, a lot of our world actually follows pretty regular patterns. Like your realization with the time machine, many are crestfallen when they realize that predictive analytics aren’t often necessary to predict the future. One can usually produce a reasonably accurate prediction of the company’s next quarterly income without the use of Poisson distributions or seasonal ARIMA models.
However, this predictable portion of the world still has at least one very serious problem that statistics can help with. It is incredibly vast. These fields of regularly repeating observations stretch as far as the eye can see. These predictable data streams are so numerous that it is impossible for people to pay attention to even a small fraction of them … and sometimes, however rarely, things do go wrong.
The ability to notice unexpected observations in the middle of an ocean of expected ones is a huge benefit data science can provide that, somewhat ironically, is easy to overlook.
The analysis that notices the unexpected is termed “anomaly detection”. It allows one to find the observations that don’t fit, at machine scale. Finding these unusual features in an enormous predictable landscape makes it easier for people to fix problems early and potentially discover unknown dynamics.
One Approach to Anomaly Detection
Anomalies are often defined in contrast to the normal pattern rather than by particular features. They are simply unexpected observations or patterns.
The analytical techniques used for prediction are actually very well suited for anomaly detection. They allow us to define what is expected so that we can see what is unexpected.
Here is one possible process for an anomaly detector:
- Develop Expectation
- Use past data and patterns to predict a range that would almost always include the next observation or set of observations.
- Compare Observations and Expectations
- Once you have measured the next observation compare it with your expectations. If the observation matches your expectations, then it is a normal reading. However, if the observation diverges from the expectations, you have found an anomaly.
Innocent Example: Anomalies in Search Volume
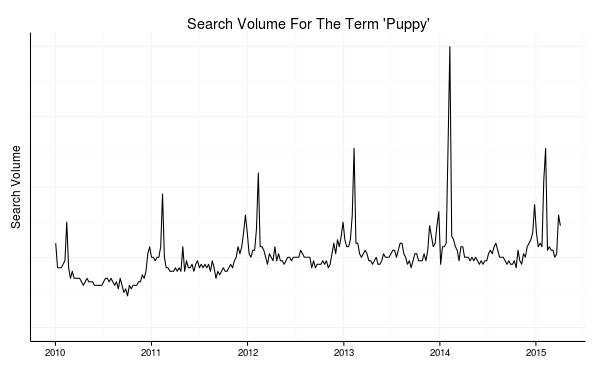
Here is a plot of the weekly search volume on Google for the term “puppy” over the last few years.

Google search volume for the term "puppy"
For the most part, this data follows a pretty regular repeating pattern. Each year looks similar to the year before. Let’s see if we can build an anomaly detector of the type mentioned above for this series.
Develop Expectations
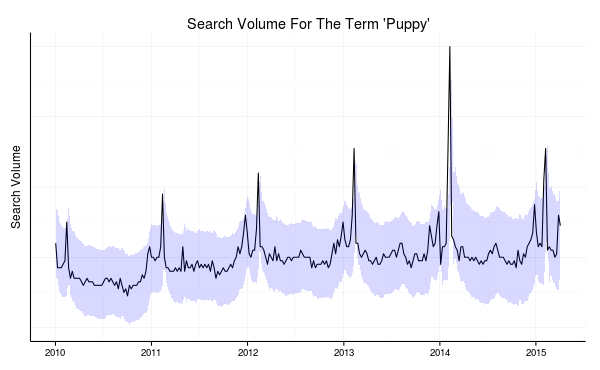
We can use a time series model to predict the next few steps in this series from past data. After a little analysis, an ARIMA(0, 1, 2)(1, 1, 0)x52 model seems to fit pretty well. Let’s use this to calculate prediction intervals around each data point given the data before that point.

Prediction intervals from our model are shown in blue, indicating what values are expected.
Compare Data with Expectations
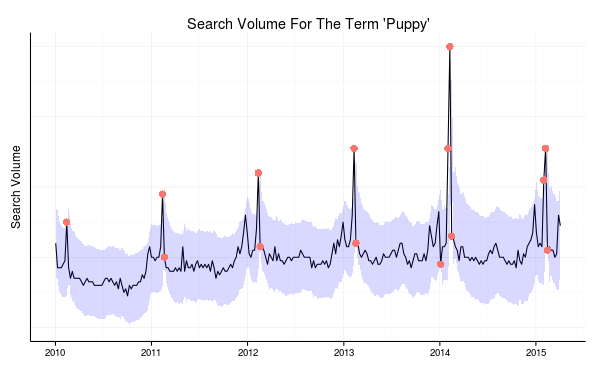
Now that we have an idea of what is normal for this series, let’s see how well the data matches our expectations. We can do this by simply seeing which points fall outside our prediction interval.

The points in red are when the search volume extended outside our prediction intervals. These points are unexpected "anomalies".
This anomaly detector has marked several big spikes (and often the abrupt end of the spike) as anomalies. I believe this is the result of the Puppy Bowl that Animal Planet airs at the same time as the Super Bowl.
These are one set of anomalies. However, even if we incorporate the Super Bowl into the model and expect a spike at that time of year, some of these are still anomalies. For example, in 2014, a Super Bowl ad named “Puppy Love” was particularly popular and increased the Super Bowl bump above its already unusually high level.
As an example, I also included an artificial anomaly in this series. It is the type that is easy for humans to miss: the lack of a spike where there normally is one. For a week in January of 2014, I lowered the value where there would normally be a relatively high search volume. The anomaly detector spotted this one too.

Creative commons photo by edanley.
Summary
A large part of our world hums along in a pleasantly predictable way. My heartbeat is usually pretty predictable, as is my daily routine, and that of the companies and systems I often interact with. However, sometimes things do go wrong or change suddenly. Whether this is with my heartbeat, company sales, or millions of other variables, I hope an anomaly detector is watching and can draw attention to these unusual observations.